Agile metrics and Key Performance Indicators (KPIs) provide critical insights into your team’s efficiency and productivity. They are an essential part of agile project management implementation. By understanding and implementing the right metrics, you can identify bottlenecks, streamline workflows, and boost overall performance. This guide will walk you through the most effective agile metrics and KPIs, showing you how to measure, analyze, and optimize your agile processes for outstanding results.
What Are Agile Metrics KPIs?
Agile metrics and Key Performance Indicators (KPIs) are tools used to measure and track the progress and effectiveness of agile teams. These measurements help teams and organizations assess their performance, identify areas for improvement, and make data-driven decisions. Agile metrics focus on providing real-time insights into team productivity, work quality, and overall project health.
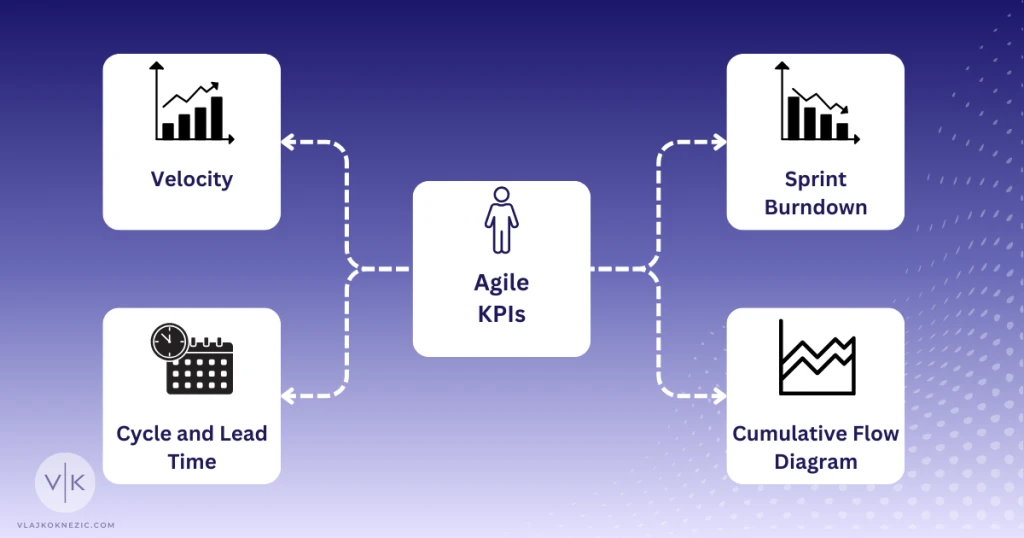
Measuring agile performance is essential for continuous improvement. It allows teams to spot bottlenecks, optimize processes, and adapt quickly to changing requirements. By tracking the right metrics, agile teams can ensure they’re delivering value to customers efficiently and consistently.
Traditional metrics often emphasize long-term planning and rigid processes, while agile metrics prioritize flexibility and iterative progress. Agile KPIs are typically more focused on team velocity, customer satisfaction, and the ability to respond to change. They’re designed to support the agile principles of continuous delivery and rapid feedback loops.
Top Agile Metrics and KPIs
Velocity
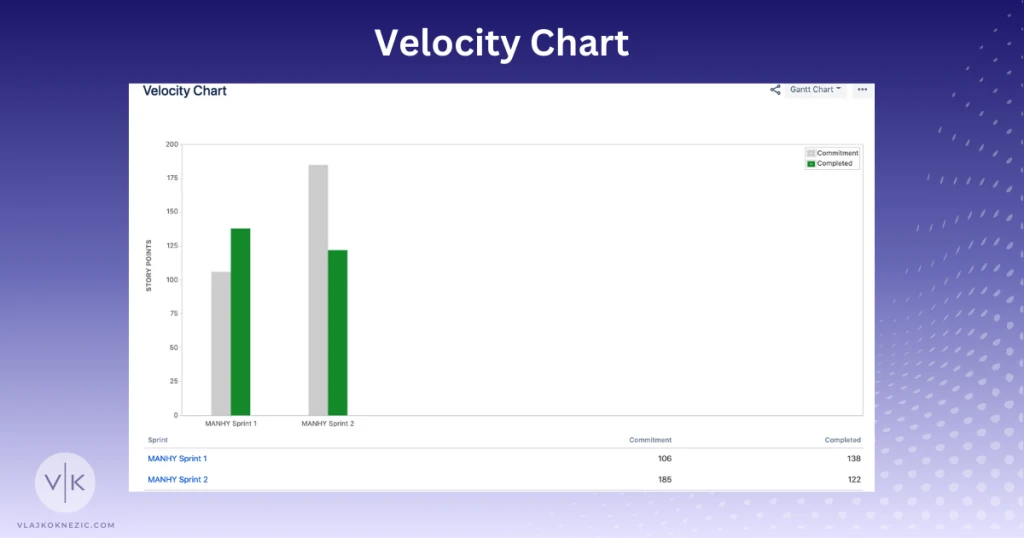
Velocity measures the amount of work a team completes in a single sprint. It’s typically expressed in story points or the number of completed user stories. Tracking velocity helps teams predict how much work they can take on in future sprints, improving sprint planning accuracy. To calculate velocity, sum up the story points of all completed user stories in a sprint. Over time, teams can use their average velocity to make more reliable commitments and set realistic expectations with stakeholders.
Sprint Burndown
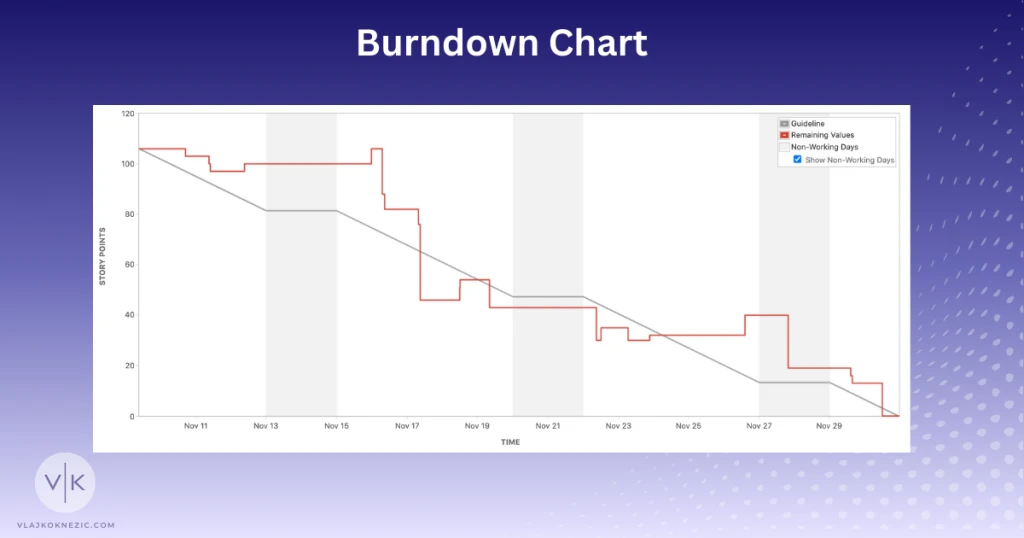
A sprint burndown chart visually represents the work remaining in a sprint over time. It helps teams track progress and identify if they’re on track to complete all planned work. The x-axis shows the sprint duration, while the y-axis represents the remaining work. An ideal burndown line is drawn from the total work at the sprint start to zero at the end. Teams can compare their actual progress against this ideal line to gauge their performance and make necessary adjustments.
Cycle Time
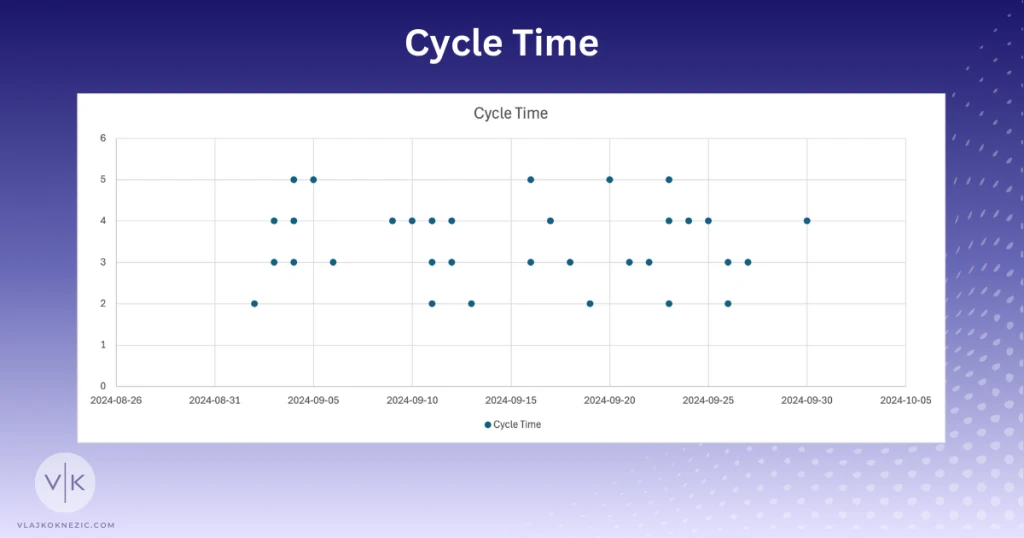
Cycle time measures the duration from when work begins on a task until it’s completed. This metric helps teams identify inefficiencies in their workflow and spot areas where work gets stuck. To improve cycle time, teams can focus on reducing wait times between stages, minimizing work in progress, and streamlining their processes. Shorter cycle times often indicate a more efficient and productive team.
Lead Time
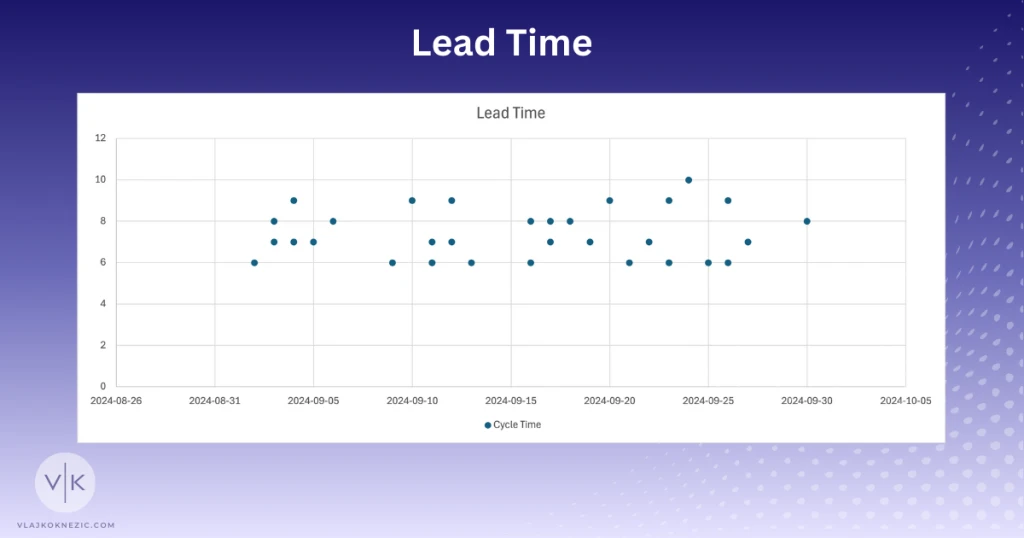
Lead time is the total time from when a task is created or requested until it’s delivered. This metric provides insight into the team’s overall responsiveness and ability to deliver value quickly. Lead time is particularly useful for understanding how long it takes for new ideas or customer requests to be implemented. Teams can work on reducing lead time by improving their prioritization process, breaking down work into smaller chunks, and eliminating unnecessary steps in their workflow.
Cumulative Flow Diagram
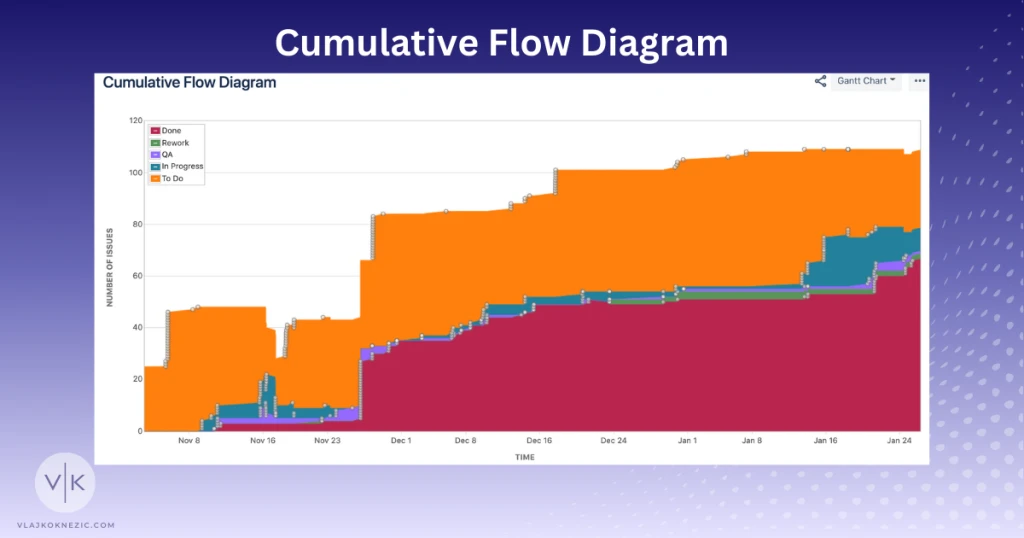
A Cumulative Flow Diagram (CFD) is a powerful visual tool that shows the status of all work items over time. It helps teams identify bottlenecks, track work in progress, and understand the flow of tasks through different stages. The x-axis represents time, while the y-axis shows the number of items. Different colored bands represent various stages in the workflow. A healthy CFD should show a relatively consistent spacing between bands, indicating a smooth flow of work.
How to Implement Agile Metrics and KPIs
Selecting the right metrics for your team is crucial for successful implementation. Start by identifying your team’s goals and challenges. Choose metrics that align with these objectives and provide actionable insights. It’s often better to focus on a few key metrics rather than tracking too many at once. Consider involving team members in the selection process to ensure buy-in and understanding.
Setting up data collection processes is the next step. Establish clear definitions for each metric and ensure everyone on the team understands how they’re calculated. Create a system for consistently recording and updating the necessary data. This might involve using physical boards, spreadsheets, or specialized software. Regular data collection should become a habit for the team.
Using agile tools and software for tracking can significantly streamline the process. Many project management tools offer built-in features for tracking agile metrics. These tools can automate data collection, generate reports, and provide real-time dashboards. Popular options include Jira, Trello, and Azure DevOps. Choose a tool that fits your team’s needs and integrates well with your existing workflows.
Common Challenges in Agile Metrics and KPI Tracking
Overemphasis on quantitative data can lead teams astray. While numbers are important, they don’t tell the whole story. Teams might focus too much on improving specific metrics at the expense of overall value delivery. For example, a team might increase their velocity by taking on easier tasks, but this doesn’t necessarily mean they’re delivering more value to customers. Balance quantitative metrics with qualitative feedback to get a more complete picture of performance.
Misinterpretation of metrics is another common pitfall. Without proper context, metrics can be misleading. For instance, a drop in velocity might be interpreted as decreased productivity, when it could be due to the team tackling more complex work. It’s essential to understand the factors influencing each metric and consider them in your analysis. Encourage open discussions about metric interpretations to avoid misunderstandings.
Balancing multiple KPIs can be challenging. Different metrics may sometimes conflict with each other. For example, focusing on increasing velocity might lead to a decrease in quality. It’s important to view metrics holistically and understand how they interact. Prioritize the metrics that align most closely with your team’s current goals and adjust as needed. Remember that the ultimate goal is to deliver value, not to optimize for specific numbers.
Best Practices for Agile Metrics and KPI Analysis
Regular review and adjustment of metrics are essential for maintaining their relevance and effectiveness. Set aside time in your retrospectives to discuss the current metrics and their impact on the team’s performance. Be open to changing or replacing metrics that are no longer providing valuable insights. As your team evolves and your projects change, your metrics should adapt accordingly.
Combining qualitative and quantitative data provides a more comprehensive view of team performance. While metrics offer concrete numbers, qualitative feedback from team members, stakeholders, and customers can provide context. Use surveys, interviews, and open discussions to gather qualitative data. This combination allows for a more balanced and accurate assessment of the team’s progress and challenges.
Involving the team in metric discussions is crucial for fostering a culture of continuous improvement. Encourage team members to share their insights and interpretations of the metrics. This not only leads to better analysis but also increases the team’s engagement with the metrics. When team members understand and buy into the metrics being used, they’re more likely to take ownership of improving them. Create a safe space for open and honest discussions about performance and areas for improvement.
Agile metrics and KPIs are vital tools for measuring and improving team performance in agile environments. This post covered the definition and importance of these metrics and provided guidance on implementation. We discussed common challenges in tracking and offered best practices for analysis. By thoughtfully selecting, implementing, and interpreting agile metrics, teams can gain valuable insights to boost their efficiency and effectiveness.